


## Description
MKTXP-Stack is a dockerized monitoring stack for [MKTXP Exporter](https://github.com/akpw/mktxp).
As an out-of-the-box solution, it lets you quickly get up & running with [MKTXP](https://github.com/akpw/mktxp), [Prometheus](https://prometheus.io/), and [Grafana](https://grafana.com/) and have your Mikrotik RouterOS devices monitored with least amount of configuration.
While complementary to [MKTXP](https://github.com/akpw/mktxp), this project also adds some extra capabilitis such an [centralized Mikrotik log processing](https://github.com/akpw/mktxp-stack#mikrotik-centralized-logging) based on [syslog-ng](https://www.syslog-ng.com/) & [Loki](https://grafana.com/docs/loki/latest).
## Requirements:
[Docker Compose](https://docs.docker.com/compose/install/)
## Install & Getting Started:
- Download the code from this repository and extract it into a directory:
```
wget https://github.com/akpw/mktxp-stack/archive/main.zip
unzip main.zip
cd mktxp-stack-main
```
- Configure mktxp as described in [MKTXP Getting Started](https://github.com/akpw/mktxp#getting-started):\
a) edit the main mktxp config file, adding your Mikrotik device ip address & authentication info to provided sample entry:
```
nano mktxp/mktxp.conf
```
b) if needed, [add a dedicated API user](https://github.com/akpw/mktxp#mikrotik-device-config) from the mktxp config to your RouterOS device:
```
/user group add name=mktxp_group policy=api,read
/user add name=mktxp_user group=mktxp_group password=mktxp_user_password
```
- Run docker-compose:
```
docker-compose -f ./docker-compose-mktxp.yml up -d
```
Now give the containers some time to start up and point your Web browser to [Grafana](http://localhost:3000), where you should see the default MKTXP Dashboard:\
 ## Mikrotik Centralized Logging
In addition to RouterOS devices monitoring, MKTXP-Stack also rovides a preconfigured [syslog-ng](https://www.syslog-ng.com/) / [promtail](https://grafana.com/docs/loki/latest/clients/promtail/) / [Loki](https://grafana.com/docs/loki/latest) stack to send logs from your Mikrotik RouterOS devices to a centralized location:
## Mikrotik Centralized Logging
In addition to RouterOS devices monitoring, MKTXP-Stack also rovides a preconfigured [syslog-ng](https://www.syslog-ng.com/) / [promtail](https://grafana.com/docs/loki/latest/clients/promtail/) / [Loki](https://grafana.com/docs/loki/latest) stack to send logs from your Mikrotik RouterOS devices to a centralized location:
 For this to work, we basically need to configure our Mikrotik devices to send their logs to a specified log server target. For this, let's first configure the corresponding remote action (replace XX.XX.XX.XX with your docker-compose host IP address):
```
/system logging action
set remote bsd-syslog=yes name=remote remote=XX.XX.XX.XX remote-port=514 src-address=0.0.0.0 syslog-facility=local0 syslog-severity=auto target=remote
```
Next, let's modify relevant log topics to use this action:
```
/system logging
set 0 action=remote prefix=:Info
set 1 action=remote prefix=:Error
set 2 action=remote prefix=:Warning
set 3 action=remote prefix=:Critical
add action=remote disabled=no prefix=:Firewall topics=firewall
add action=remote disabled=no prefix=:Account topics=account
add action=remote disabled=no prefix=:Caps topics=caps
add action=remote disabled=no prefix=:Wireles topics=wireless
```
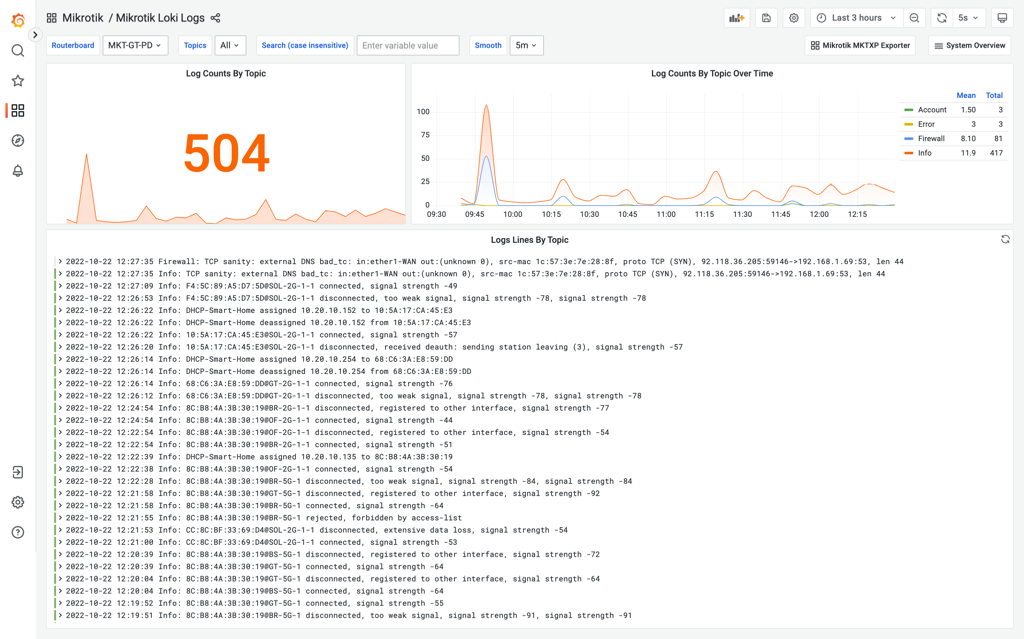
From there, point your Web browser to included [Grafana dashboards](http://localhost:3000/dashboards) and open "Mikrotik Loki Logs"
For this to work, we basically need to configure our Mikrotik devices to send their logs to a specified log server target. For this, let's first configure the corresponding remote action (replace XX.XX.XX.XX with your docker-compose host IP address):
```
/system logging action
set remote bsd-syslog=yes name=remote remote=XX.XX.XX.XX remote-port=514 src-address=0.0.0.0 syslog-facility=local0 syslog-severity=auto target=remote
```
Next, let's modify relevant log topics to use this action:
```
/system logging
set 0 action=remote prefix=:Info
set 1 action=remote prefix=:Error
set 2 action=remote prefix=:Warning
set 3 action=remote prefix=:Critical
add action=remote disabled=no prefix=:Firewall topics=firewall
add action=remote disabled=no prefix=:Account topics=account
add action=remote disabled=no prefix=:Caps topics=caps
add action=remote disabled=no prefix=:Wireles topics=wireless
```
From there, point your Web browser to included [Grafana dashboards](http://localhost:3000/dashboards) and open "Mikrotik Loki Logs"