4.8 KiB
![]()
![]()
Description
MKTXP-Stack is a dockerized monitoring stack for MKTXP Exporter.
As an out-of-the-box solution, it lets quickly get up & running with MKTXP, Prometheus, and Grafana and have multiple Mikrotik RouterOS devices monitored with least amount of configuration.
While complementary to MKTXP, this project also adds some extra capabilities such an centralized Mikrotik log processing based on a preconfigured syslog-ng / promtail / Loki stack.
The project offers multiple docker-compose configurations, to load only relevant parts of the stack as actually required.
Requirements:
Install & Getting Started:
- Download the code from this repository and extract it into a directory:
wget https://github.com/akpw/mktxp-stack/archive/main.zip
unzip main.zip
cd mktxp-stack-main
MKTXP Exporter configuration
-
Following the steps described in MKTXP Getting Started, let's:
a) edit the main mktxp config file, adding your Mikrotik device IP address & authentication info to provided sample entry:nano mktxp/mktxp.confb) if needed, add a dedicated API user from the mktxp config to your RouterOS device:
/user group add name=mktxp_group policy=api,read /user add name=mktxp_user group=mktxp_group password=mktxp_user_password -
Run docker-compose:
docker-compose -f ./docker-compose-mktxp-stack.yml up -d
Now give the containers some time to start up and point your Web browser to Grafana.
You should see the default MKTXP Dashboard:

Mikrotik Centralized Logging configuration
In addition to RouterOS devices monitoring, MKTXP-Stack provides a preconfigured syslog-ng / promtail / Loki stack to send logs from your Mikrotik RouterOS devices to a centralized location:
To make it work, we need to configure our Mikrotik devices to send their logs to a specified log server target. Let's first configure the corresponding remote logging action (replace XX.XX.XX.XX with your docker-compose host IP address):
/system logging action
set remote bsd-syslog=yes name=remote remote=XX.XX.XX.XX remote-port=514 src-address=0.0.0.0 syslog-facility=local0 syslog-severity=auto target=remote
Next, let's modify relevant log topics to use this action:
/system logging
set 0 action=remote prefix=:Info
set 1 action=remote prefix=:Error
set 2 action=remote prefix=:Warning
set 3 action=remote prefix=:Critical

add action=remote disabled=no prefix=:Firewall topics=firewall
add action=remote disabled=no prefix=:Account topics=account
add action=remote disabled=no prefix=:Caps topics=caps
add action=remote disabled=no prefix=:Wireles topics=wireless
Unless you already done it during the previous MKTXP Exporter configuration, run docker-compose:
docker-compose -f ./docker-compose-mktxp-stack.yml up -d
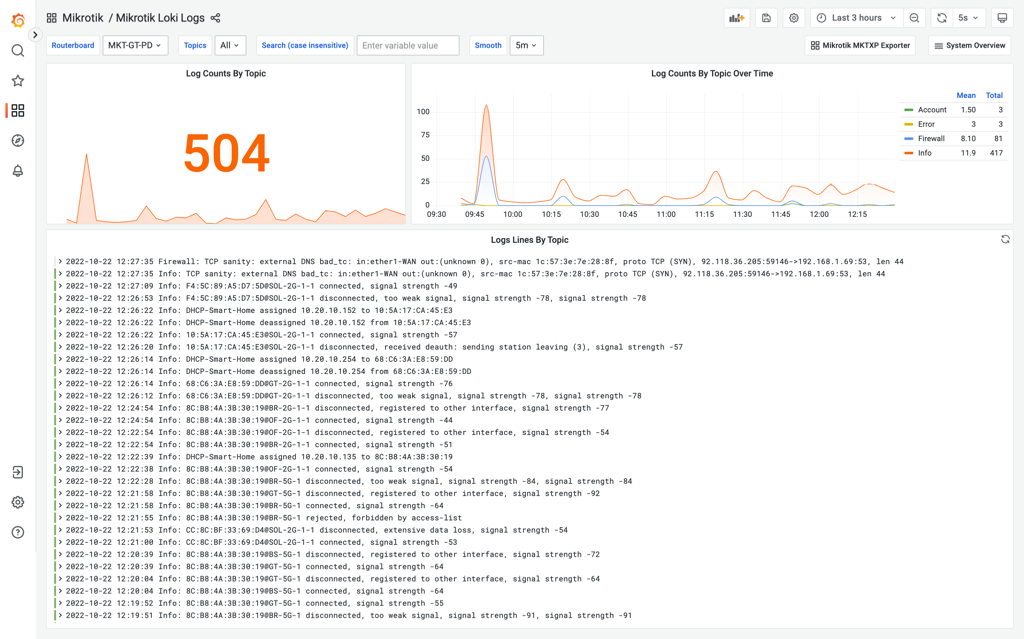
As soon as the containers are up & running, just point your Web browser to included Grafana dashboards and open the one called "Mikrotik Loki Logs".
Alternative docker-compose configurations
The project offers multiple [ocker-compose files to load only relevant parts of the stack as actually required.
To go with full stack, run docker-compose as described above:
docker-compose -f ./docker-compose-mktxp-stack.yml up -d
In case you need only MKTXP Exporter functionality:
docker-compose -f ./docker-compose-mktxp-stack-no-logs.yml up -d
If only central logging is needed:
docker-compose -f ./docker-compose-mktxp-stack-logs-only.yml up -d