110 lines
6.3 KiB
Markdown
110 lines
6.3 KiB
Markdown

|
|

|
|

|
|

|
|
|
|
### Description
|
|
MKTXP-Stack is a dockerized monitoring stack for [MKTXP Exporter](https://github.com/akpw/mktxp).
|
|
|
|
As an out-of-the-box solution, it lets you quickly get up & running with [MKTXP](https://github.com/akpw/mktxp), [Prometheus](https://prometheus.io/), and [Grafana](https://grafana.com/) and have multiple Mikrotik RouterOS devices monitored with least amount of configuration.
|
|
|
|
While complementary to [MKTXP](https://github.com/akpw/mktxp), this project also adds some extra capabilities such an [centralized Mikrotik log processing](https://github.com/akpw/mktxp-stack#mikrotik-centralized-logging-configuration) based on a preconfigured [syslog-ng](https://www.syslog-ng.com/) / [promtail](https://grafana.com/docs/loki/latest/clients/promtail/) / [Loki](https://grafana.com/docs/loki/latest) stack.
|
|
|
|
The project offers multiple [docker-compose configurations](https://github.com/akpw/mktxp-stack/blob/main/README.md#alternative-docker-compose-configurations), so only relevant parts of the stack can be loaded.
|
|
|
|
|
|
### Requirements:
|
|
[Docker Compose](https://docs.docker.com/compose/install/)
|
|
|
|
|
|
### Install & Getting Started:
|
|
- Download the code from this repository and extract it into a directory:
|
|
```
|
|
git clone https://github.com/akpw/mktxp-stack.git
|
|
cd mktxp-stack
|
|
```
|
|
|
|
#### MKTXP Exporter configuration
|
|
- Following the steps described in [MKTXP Getting Started](https://github.com/akpw/mktxp#getting-started), let's:\
|
|
a) edit the main mktxp config file, adding your Mikrotik device IP address & authentication info to provided sample entry:
|
|
```
|
|
nano mktxp/mktxp.conf
|
|
```
|
|
|
|
b) if needed, [add a dedicated API user](https://github.com/akpw/mktxp#mikrotik-device-config) from the mktxp config to your RouterOS device:
|
|
```
|
|
/user group add name=mktxp_group policy=api,read
|
|
/user add name=mktxp_user group=mktxp_group password=mktxp_user_password
|
|
```
|
|
|
|
With that out the of way, things should be ready for running docker-compose:
|
|
```
|
|
docker-compose -f ./docker-compose-mktxp-stack.yml up -d
|
|
```
|
|
|
|
Now give the containers some time to start up, and then point a Web browser to [Grafana](http://localhost:3000). You should see the default [MKTXP Exporter Dashboard](https://grafana.com/grafana/dashboards/13679-mikrotik-mktxp-exporter/):\
|
|

|
|
|
|
|
|
|
|
#### Mikrotik Centralized Logging configuration
|
|
In addition to RouterOS devices monitoring, MKTXP-Stack provides a preconfigured [syslog-ng](https://www.syslog-ng.com/) / [promtail](https://grafana.com/docs/loki/latest/clients/promtail/) / [Loki](https://grafana.com/docs/loki/latest) stack to receieve & process logs from multiple Mikrotik RouterOS devices in a centralized location:
|
|
|
|
|
|
|
|
To make this work, we need to configure our Mikrotik devices to send their logs to a specified log server target. Let's first configure the corresponding remote logging action (replace XX.XX.XX.XX with your docker-compose host IP address):
|
|
```
|
|
/system logging action
|
|
set remote bsd-syslog=yes name=remote remote=XX.XX.XX.XX remote-port=514 src-address=0.0.0.0 syslog-facility=local0 syslog-severity=auto target=remote
|
|
```
|
|
Next, let's modify relevant log topics to use with this remote action:
|
|
```
|
|
/system logging
|
|
set 0 action=remote prefix=:Info
|
|
set 1 action=remote prefix=:Error
|
|
set 2 action=remote prefix=:Warning
|
|
set 3 action=remote prefix=:Critical
|
|
|
|
add action=remote disabled=no prefix=:Firewall topics=firewall
|
|
add action=remote disabled=no prefix=:Account topics=account
|
|
add action=remote disabled=no prefix=:Caps topics=caps
|
|
add action=remote disabled=no prefix=:Wireles topics=wireless
|
|
```
|
|
You can extend the list above as needed, following [Mikrotik's description](https://help.mikrotik.com/docs/display/ROS/Log) of the log topics used by various RouterOS facilities
|
|
|
|
Now all should be ready and, unless you already done so during the previous [MKTXP Exporter configuration](https://github.com/akpw/mktxp-stack#mktxp-exporter-configuration), it's time for docker-compose:
|
|
```
|
|
docker-compose -f ./docker-compose-mktxp-stack.yml up -d
|
|
```
|
|
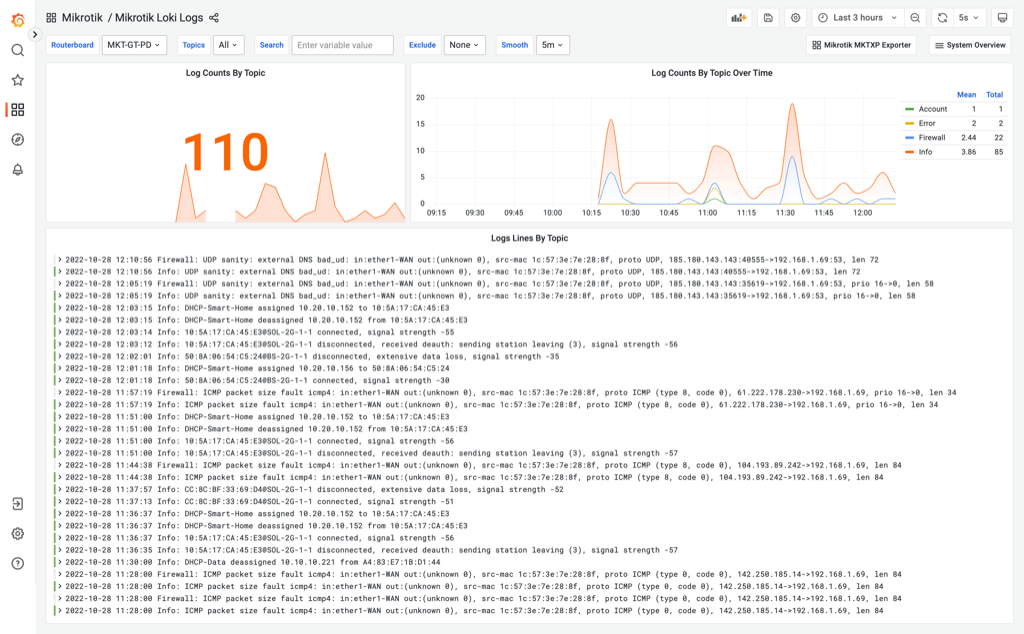
As soon as the containers are up & running, just point your Web browser to included [Grafana dashboards](http://localhost:3000/dashboards) and open the one called "Mikrotik Loki Logs".
|
|
|
|
## Alternative docker-compose configurations
|
|
The project offers multiple docker-compose files to load only relevant parts of the stack as actually required.
|
|
|
|
To go with full stack, run docker-compose as described above:
|
|
```
|
|
docker-compose -f ./docker-compose-mktxp-stack.yml up -d
|
|
```
|
|
|
|
In case you need only MKTXP Exporter functionality:
|
|
```
|
|
docker-compose -f ./docker-compose-mktxp-stack-no-logs.yml up -d
|
|
```
|
|
|
|
|
|
|
|
## Overview of components used in this project:
|
|
- [MKTXP Exporter](https://github.com/akpw/mktxp): an open-source Prometheus Exporter for Mikrotik RouterOS devices
|
|
- [Prometheus](https://prometheus.io/): an open-source monitoring & alerting toolkit for cloud / native environments
|
|
- [Grafana](https://grafana.com/): an open-source analytics & interactive visualization platform
|
|
- [Loki](https://grafana.com/oss/loki/): an open-source log aggregation system inspired by Prometheus
|
|
- [promtail](https://grafana.com/docs/loki/latest/clients/promtail/): an open-source agent to deliver the logs to Loki ]
|
|
- [syslog-ng](https://www.syslog-ng.com/): an open-source log server implementing the syslog protocol
|
|
|
|
## Included Dashboards
|
|
- [MKTXP Exporter Dashboard](https://grafana.com/grafana/dashboards/13679-mikrotik-mktxp-exporter/): set as default Grafana dashboard
|
|
- [Mikrotik Loki Logs](https://grafana.com/grafana/dashboards/17139-mikrotik-loki-logs/): logging dashboard designed for this project
|
|
- [Grafana Internals](https://grafana.com/grafana/dashboards/3590-grafana-internals/): Grafana-related stats for system overivew, credited to [Grafana community](https://grafana.com/grafana/dashboards/)
|
|
- [Prometheus 2.0 Stats](https://grafana.com/grafana/dashboards/15489-prometheus-2-0-stats/): Prometheus-related stats for system overivew, credited to [Grafana community](https://grafana.com/grafana/dashboards/)
|
|
|