![]()
![]()
Description
MKTXP-Stack is a dockerized monitoring stack for MKTXP Exporter.
As an out-of-the-box solution, it lets you quickly get up & running with MKTXP, Prometheus, and Grafana and have your Mikrotik RouterOS devices monitored with least amount of configuration.
While complementary to MKTXP, this project also adds some extra capabilitis such an Mikrotik log processing based on syslog-ng & Loki.
Requirements:
Install & Getting Started:
- Download the code from this repository and extract it into a directory:
wget https://github.com/akpw/mktxp-stack/archive/main.zip
unzip main.zip
cd mktxp-stack-main
-
Configure mktxp as described in MKTXP Getting Started:
a) edit the main mktxp config file, adding your Mikrotik device ip address & authentication info to provided sample entry:nano mktxp/mktxp.confb) if needed, add a dedicated API user from the mktxp config to your RouterOS device:
/user group add name=mktxp_group policy=api,read /user add name=mktxp_user group=mktxp_group password=mktxp_user_password -
Run docker-compose:
docker-compose -f ./docker-compose-mktxp.yml up -d
Now give the containers some time to start up and point your Web browser to Grafana, where you should see the default MKTXP Dashboard:

Mikrotik Logging pipeline
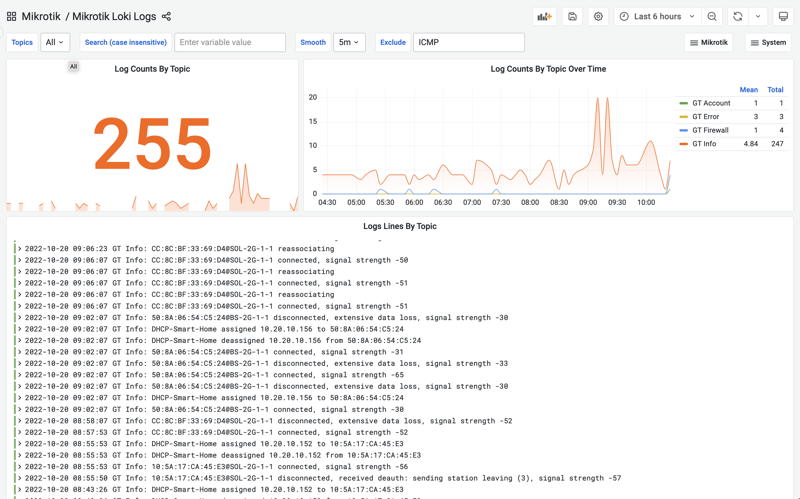 In addition to RouterOS devices monitoring, MKTXP-Stack also rovides a preconfigured syslong-ng / promtail / loki stack to easily send your router logs to a centralized location for further processing in a visual way.